Chapter 5 Brazil - 2016 Rio Olympics
Analysis of Regional Economic Impacts of Hosting Olympics on Brazil
Introduction
In this section, we discuss the regional difference of economic impacts on Brazil by the 2016 Olympic Games. To find whether or not there are significant differences on a regional level, we analyze Brazil GDP, monthly income, unemployment rate and tourism over years. The 2016 Olympic Games took place at Rio de Janeiro. Rio was awarded to host the games in 2009.
Region Description
We divide Brazil to 5 regions, where Rio de Janeiro, the city hosted Olympics, is in the South-East Region.
1. North region: Acre, Amapá, Amazonas, Pará, Rondônia, Roraima and Tocantins.
2. Northeast region: Alagoas, Bahia, Ceará, Maranhão, Paraíba, Pernambuco, Piauí, Rio Grande do Norte and Sergipe.
3. Midwest region: Goiás, Mato Grosso, Mato Grosso do Sul and Distrito Federal (Federal District).
4. Southeast region: Espírito Santo, Minas Gerais, Rio de Janeiro and São Paulo.
5. South region: Paraná, Rio Grande do Sul and Santa Catarina.
Reference: https://en.wikipedia.org/wiki/Regions_of_Brazil
5.1 Brazil GDP
Brazil Regional GDP
First, we want to visualize the regional GDP of Brazil, so we make a multiple time series plot. Also, we add two vertical lines to mark the year of final selection (2009) and the year of the Olympics (2016).
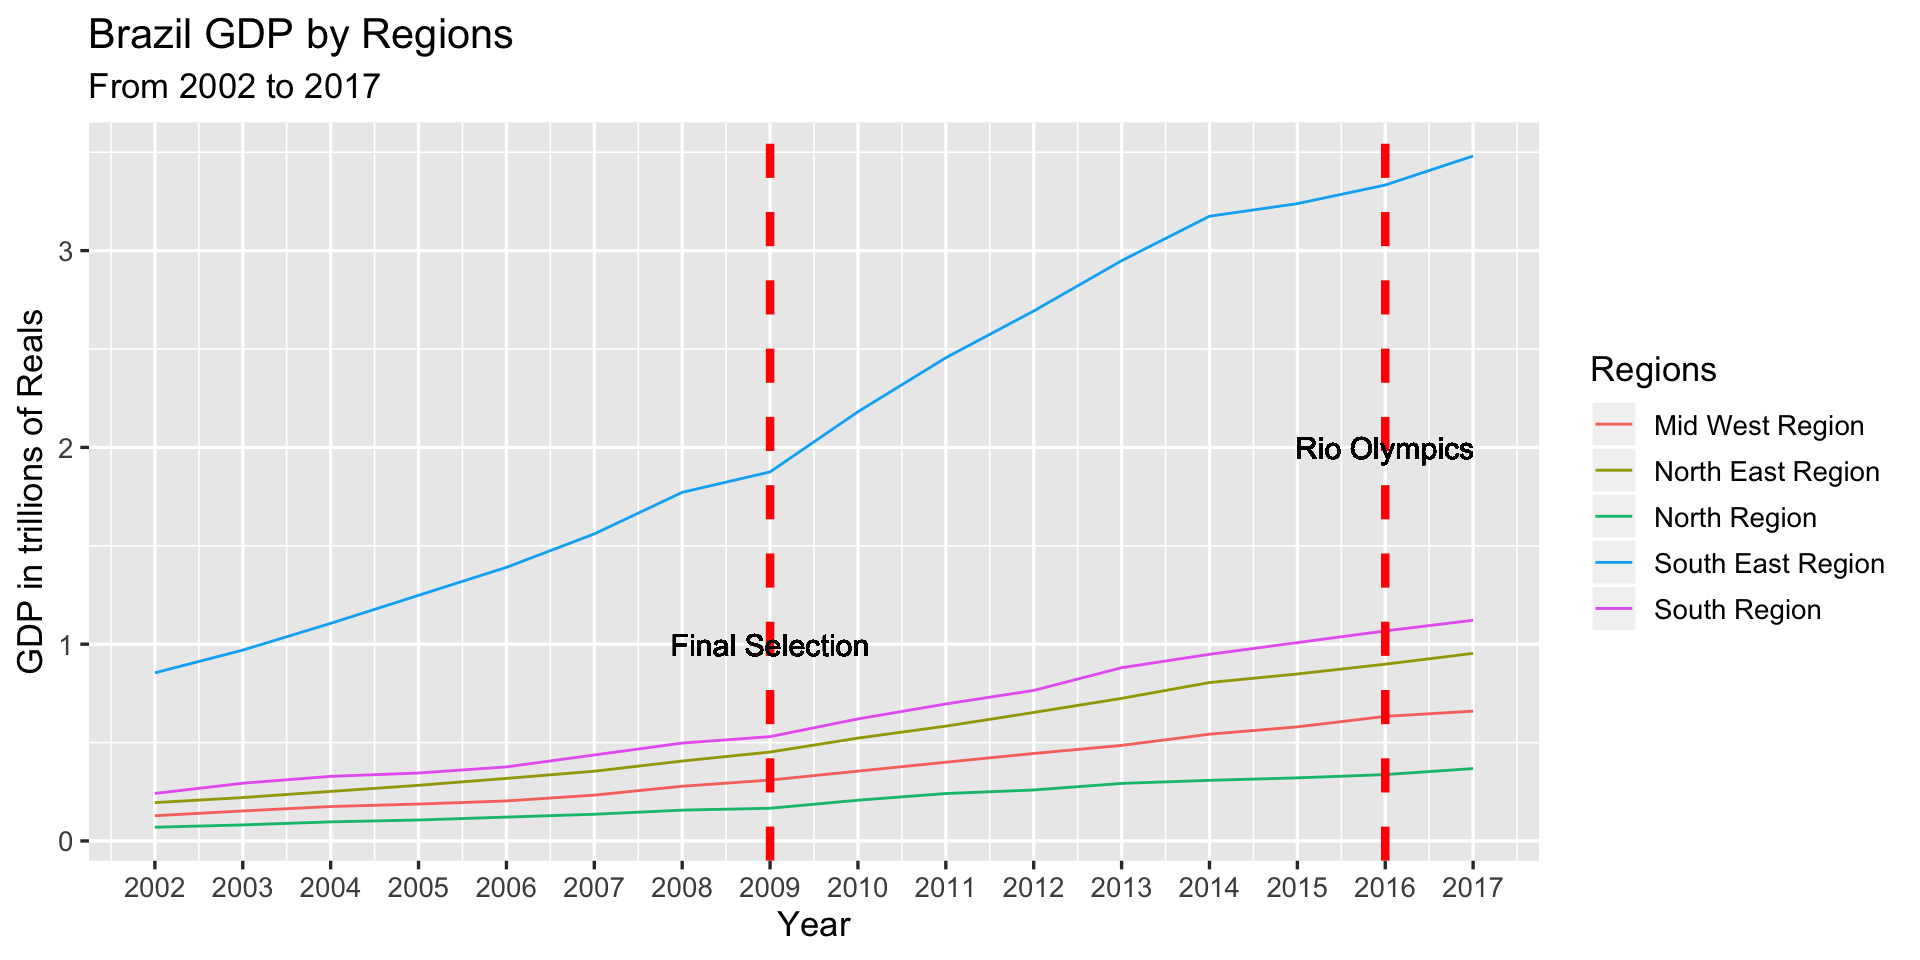
From this plot, we find that from year 2002 to 2017, South East region always has a higher GDP than other 4 regions. After year 2019, the GDP for all of the 5 regions seem to increase faster than before, especially the South East region. Since 2009 is the year when Rio was awarded to host the 2016 Olympics, we come up with a hypothesis that the success of the bid for Brazil helps to increase the GDP growth rate, especially for the South East. In other words, the final selection brings different regional GDP growth impact on Brazil.
However, the plot does not show a higher increasing rate for all of the 5 regions after the Olympic year 2016. Also, since our raw data does not provide the statistics after year 2017, our analysis may have some limitation to analyze the regional GDP impact after year 2016. Also, the plot shows that the GDP growth rate of South East region decreases from 2014 to 2016.
Before we get to our conclusion, we want to get a closer look at regional GDP growth rate.
Brazil Regional GDP Increasing Rate from 2003 to 2017
From this table, we find that the highest GDP growth rate appears at year 2010 in North region, which is 24.60%, whereas the lowest GDP growth rate appears at year 2015 in South East region, which is 2.02%. Also, the regional GDP increase rate peaked at 2010 for almost all regions. Year 2010 is the year after the final selection of Olympics, whereas year 2015 is the year before the Olympic games.
The table also shows that in year 2016, the GDP growth rate for each of the 5 regions has no significant changes compared to 2015. The highest increase in GDP growth rate appears at Mid West region in the Olympic year, but the increasing percent is \(9.2\%-6.84\% = 2.36\%\), which is small. The changes of growth rate in year 2017 are also not significant for the 5 regions.
Moreover, we find that before year 2019, the GDP growth rate for all 5 regions stays around 10+ percent, but the previous multiple time series plot shows that South East region may have a higher GDP growth rate than the other 4 regions after 2009. If we have an assumption that “before 2009, all of the 5 regions in Brazil have the same GDP growth rate”, we can then test whether the 5 regions still have the same GDP growth rate after 2009. The reason why we want to do this test is to check if the success of Olympic bid will bring a more significant GDP growth for South East region. Therefore, we want to first test our assumption by using a One-Way ANOVA test using the existing data from 2003 to 2009.
First ANOVA test on regional GDP from 2003 to 2009:
Hypothesis:
\(H_0\): The means of GDP increasing rate for the 5 regions from 2003 to 2009 are the same.
\(H_1\): Otherwise.
Description: This test is for checking whether our initial assumption holds, where the assumption is “Before the final selection year, the 5 regions in Brazil have the same GDP growth rate”.
Summary of the test:
##             Df  Sum Sq   Mean Sq F value Pr(>F)
## region       4 0.00143 0.0003574   0.212   0.93
## Residuals   30 0.05062 0.0016873
Conclusion:
From the summary of test table, we find that the p-value is 0.93, which shows that we fail to reject the null hypothesis. That is, we cannot say the mean of GDP growth rate for each of the 5 regions have significant difference. Therefore, our initial assumption holds, then we can continue to test whether there are significant differences in the means of GDP growth rate for the 5 regions after 2009. In the next test, we still use the One-Way ANOVA test, but we use the existing data from 2010 to 2017.
Second ANOVA test on regional GDP from 2010 to 2017:
Hypothesis:
\(H_0\): The means of GDP increasing rate for the 5 regions from 2010 to 2017 are the same.
\(H_1\): Otherwise.
Description: Based on the assumption from the first ANOVA test, we want to conduct a second test to check whether the means of GDP growth rate for the 5 regions still remain the same from 2010 to 2017. If the test result shows a significant difference in the means, we can conclude that the succuss of 2016 Olympic bid shows a significant GDP growth on regional levels.
Summary of the test:
##             Df  Sum Sq   Mean Sq F value Pr(>F)
## region       4 0.00276 0.0006893   0.292  0.881
## Residuals   35 0.08270 0.0023629
Conclusion:
From the summary table, we find that the p-value is 0.881, which shows that we fail to reject the null hypothesis. That is, from 2010 to 2017, we cannot say the GDP growth rate for each of the 5 regions has a significant difference.
For both tests, we fail to reject the null hypothesis. Therefore, the year 2009 does not bring a different regional GDP growth rate impact on Brazil. This conclusion is not consistent with our initial hypothesis from the multiple time series plot.
In conclusion, for Brazil regional GDP analysis, the data does not show that the Olympic games result in any significant difference in GDP growth across the regions in Brazil.
5.2 Brazil Monthly Income
Monthly Income Distribution
Before we analyze the regional average monthly income, we want to first visualize the distribution of monthly income for the entire country from 2012 to 2020. This will help us to get a better understanding of the overall distribution of Brazil monthly income over years. We first make a multiple boxplot over years to better visualize the robust statistics: medians, quartiles and outliers.
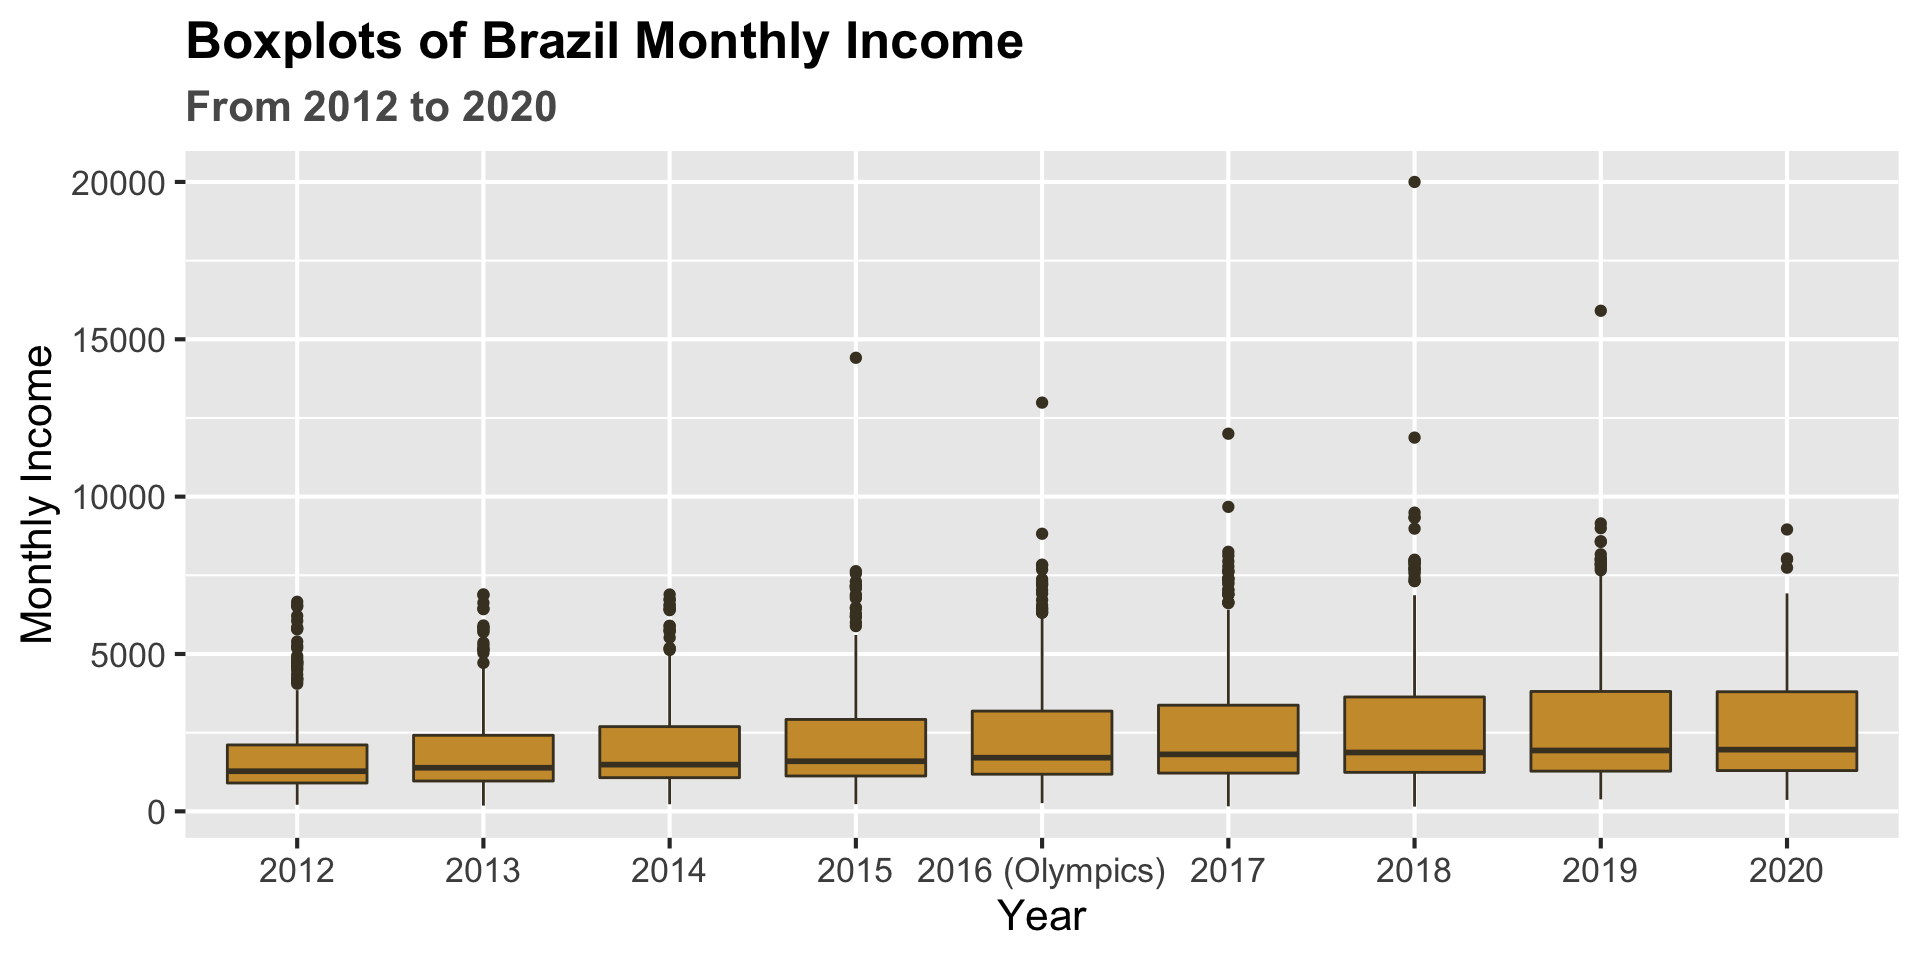
From the boxplots we find that the median of national monthly income shows an increasing pattern from 2012 to 2020. However, the plot does not show any significant increase in the median of monthly income after the Olympic year 2016 on national level. The Interquartile Range also increases from 2012 to 2020.
Then we want to visualize the density distribution for the national monthly income, but by the boxplots, there are higher outliers for each year. If we keep those outliers, it will be hard to visualize the density plot, so we remove those outliers for better visualization.
Note: Higher Outlier definition: points above \(Q_3 + (1.5\times \text{IQR})\), where \(Q_3\) is the upper quartile and IQR is the Interquatile Range.
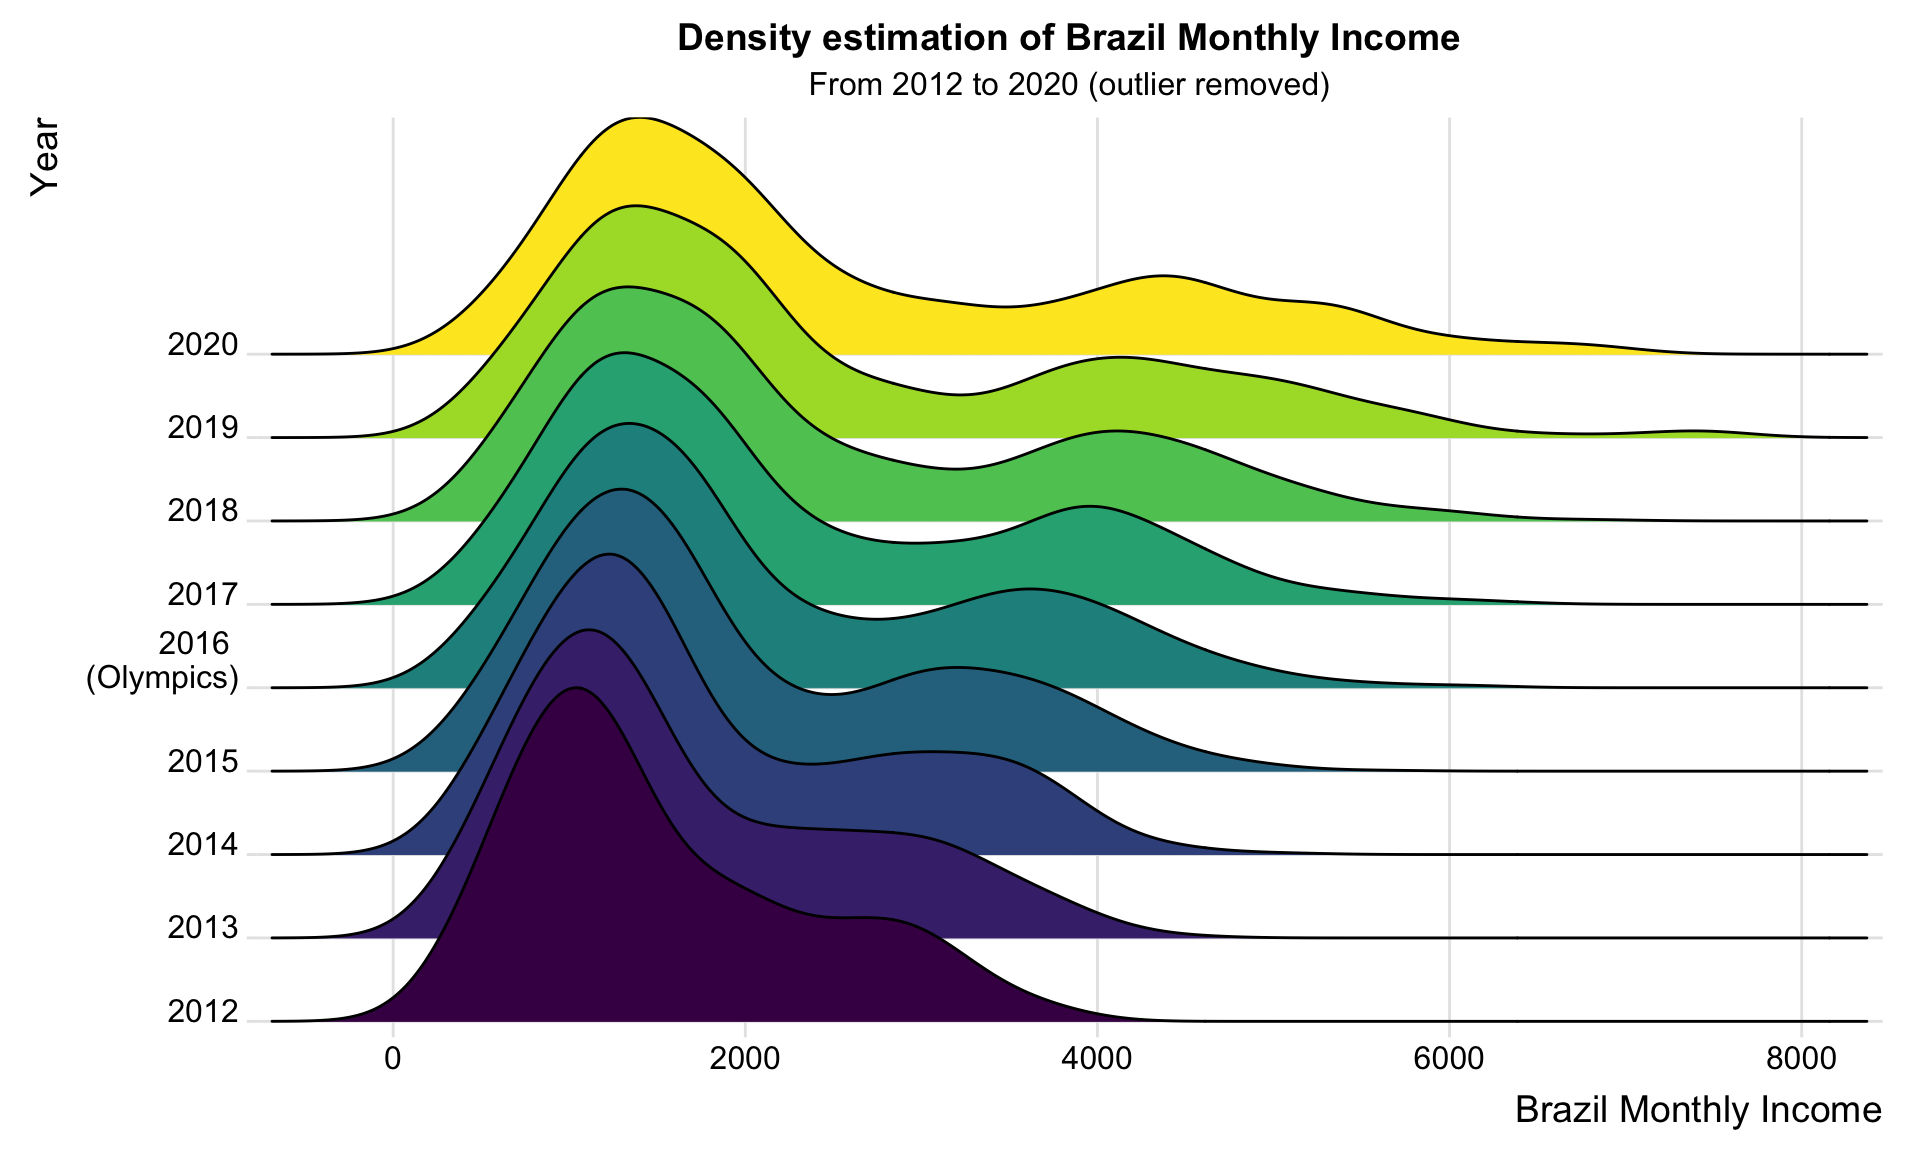
The ridgeline plot helps us to better understand the density estimation. From 2012 to 2020, the peak of density curves increases from 1000 to 1500 approximately. Also, the tail of the density curves becomes much heavier from 2012 to 2020. These observations shows that the monthly income has an increasing pattern over years. However, between 2015 and 2017, the density curves do not show a more significant increasing pattern.
Regional Monthly Income Distribution in the Olympics Year 2016
Next, we want to focus on the regional level. We pick data of the Olympic year 2016 and plot a set of histograms grouped by regions. We want to first check whether there are any significant difference in the distributions of regional monthly income. If hosting the Olympics may result in different regional impact, there may be difference in the regional distribution of monthly income in 2016.
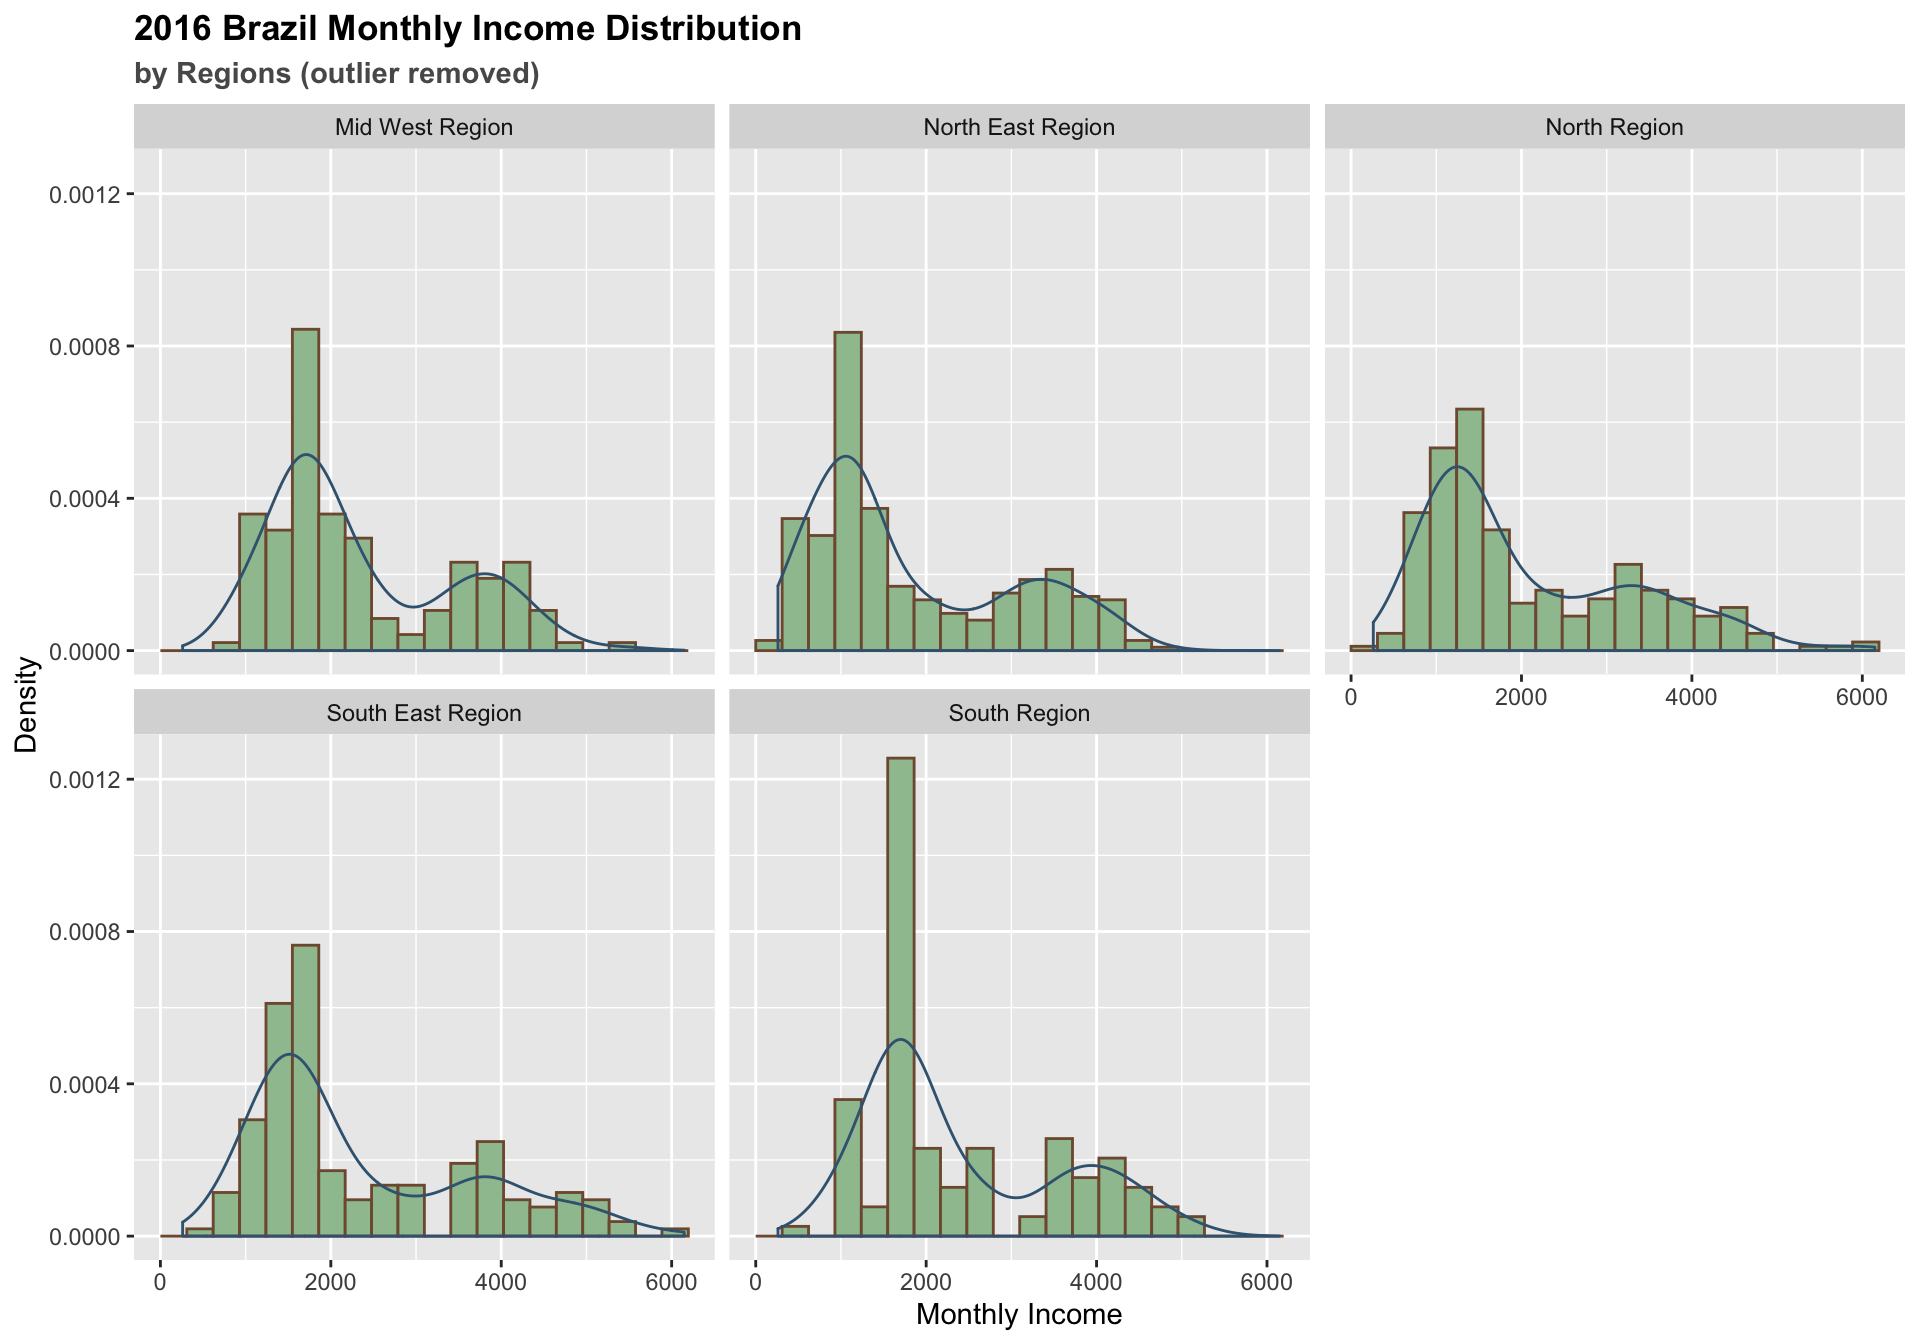
In this plot, we also remove the outliers for better visualization. The histograms shows all of the 5 regions have most density in monthly income less than 2000 but greater than 1000. Also, South East region does not show a distribution of higher monthly income than other regions in year 2016.
Regional Average Monthly Income
Now we move to visualize the regional average monthly income. Here we keep the outliers because we are calculating the regional average for each year.
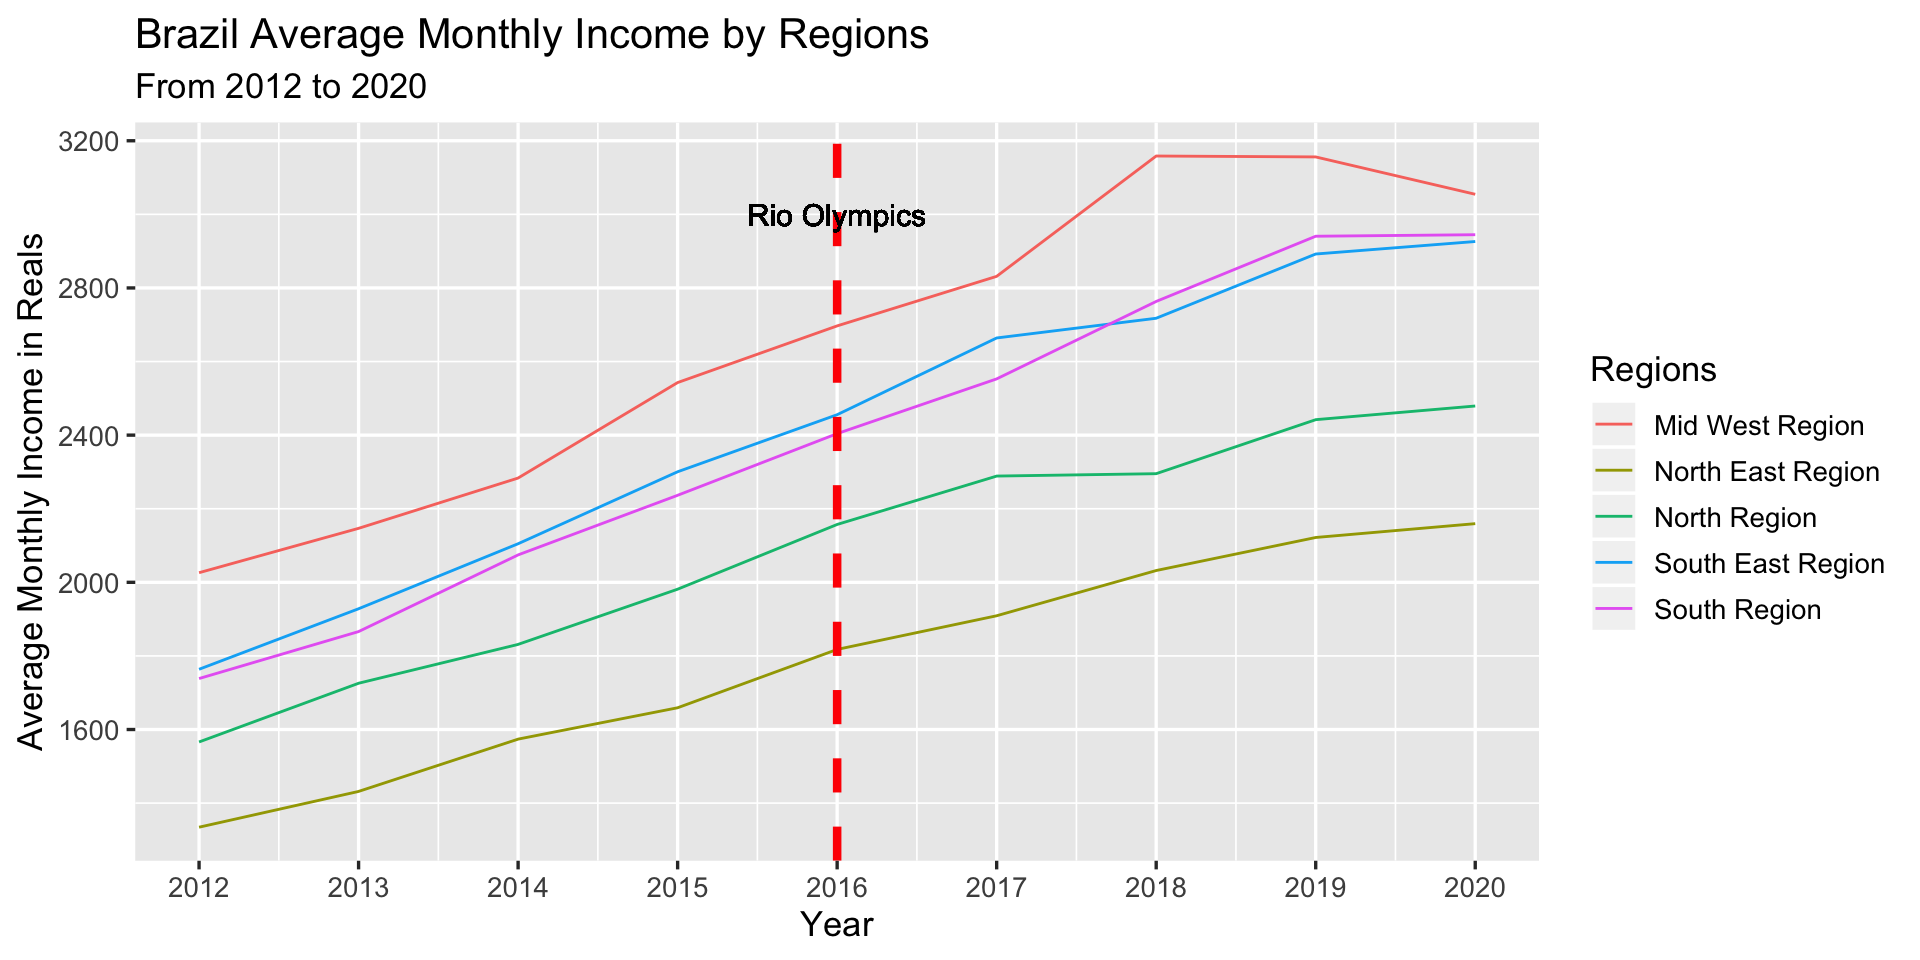
The plot shows an overall increasing pattern in monthly income for all of the 5 regions, where the income of Mid West region increases most fast from 2017 to 2018, but decreases from 2019 to 2020. The plot does not show a more significant increasing after 2016 than before. Also the patterns for all of the 5 regions do not appear to have significant difference.
Regional Monthly Income Increasing Rate from 2013 to 2020
From the income increasing rate table, we find that the highest rate (11.55%) takes place at Mid West region in 2018, whereas the lowest one (-3.22%) takes place at Mid West region in 2020. For South East Region, the increasing rate in 2016 is lower than that in 2015. Together with the multiple time series plot, we find that the regional monthly income increases after the Olympic year, but the increasing rates do not become much more significant comparing with previous ones before 2016.
Relationship between Brazil GDP and Monthly Income
Then we create an animated scatter plot to visualize the relationship between GDP and month income by regions over years.
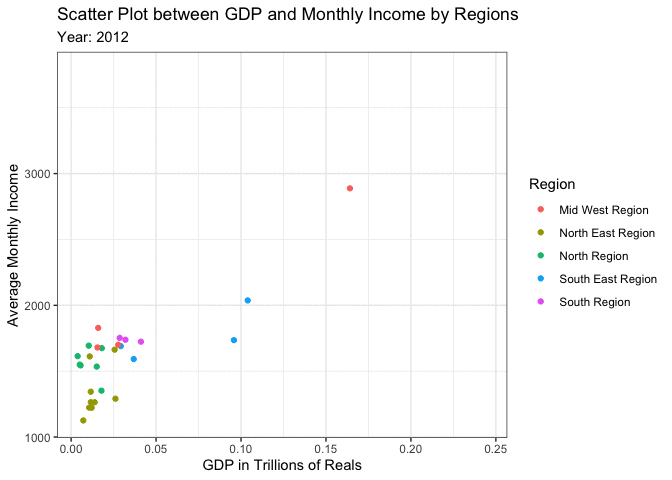
From this plot, we find that the points are moving up and right. Each of these point represents a state in Brazil and the color shows its region. One state in Mid West region has the highest GDP and monthly income over years. Also, two states in South East region have higher GDP than the majority of states.
5.3 Brazil Unemployment Rate
Another way we can analyze the potential impact of the Olympic Games on Brazil is through analyzing the unemployment rate over time. First we make a stacked bar chart to visualization the national unemployment rate from 2012 to 2019.
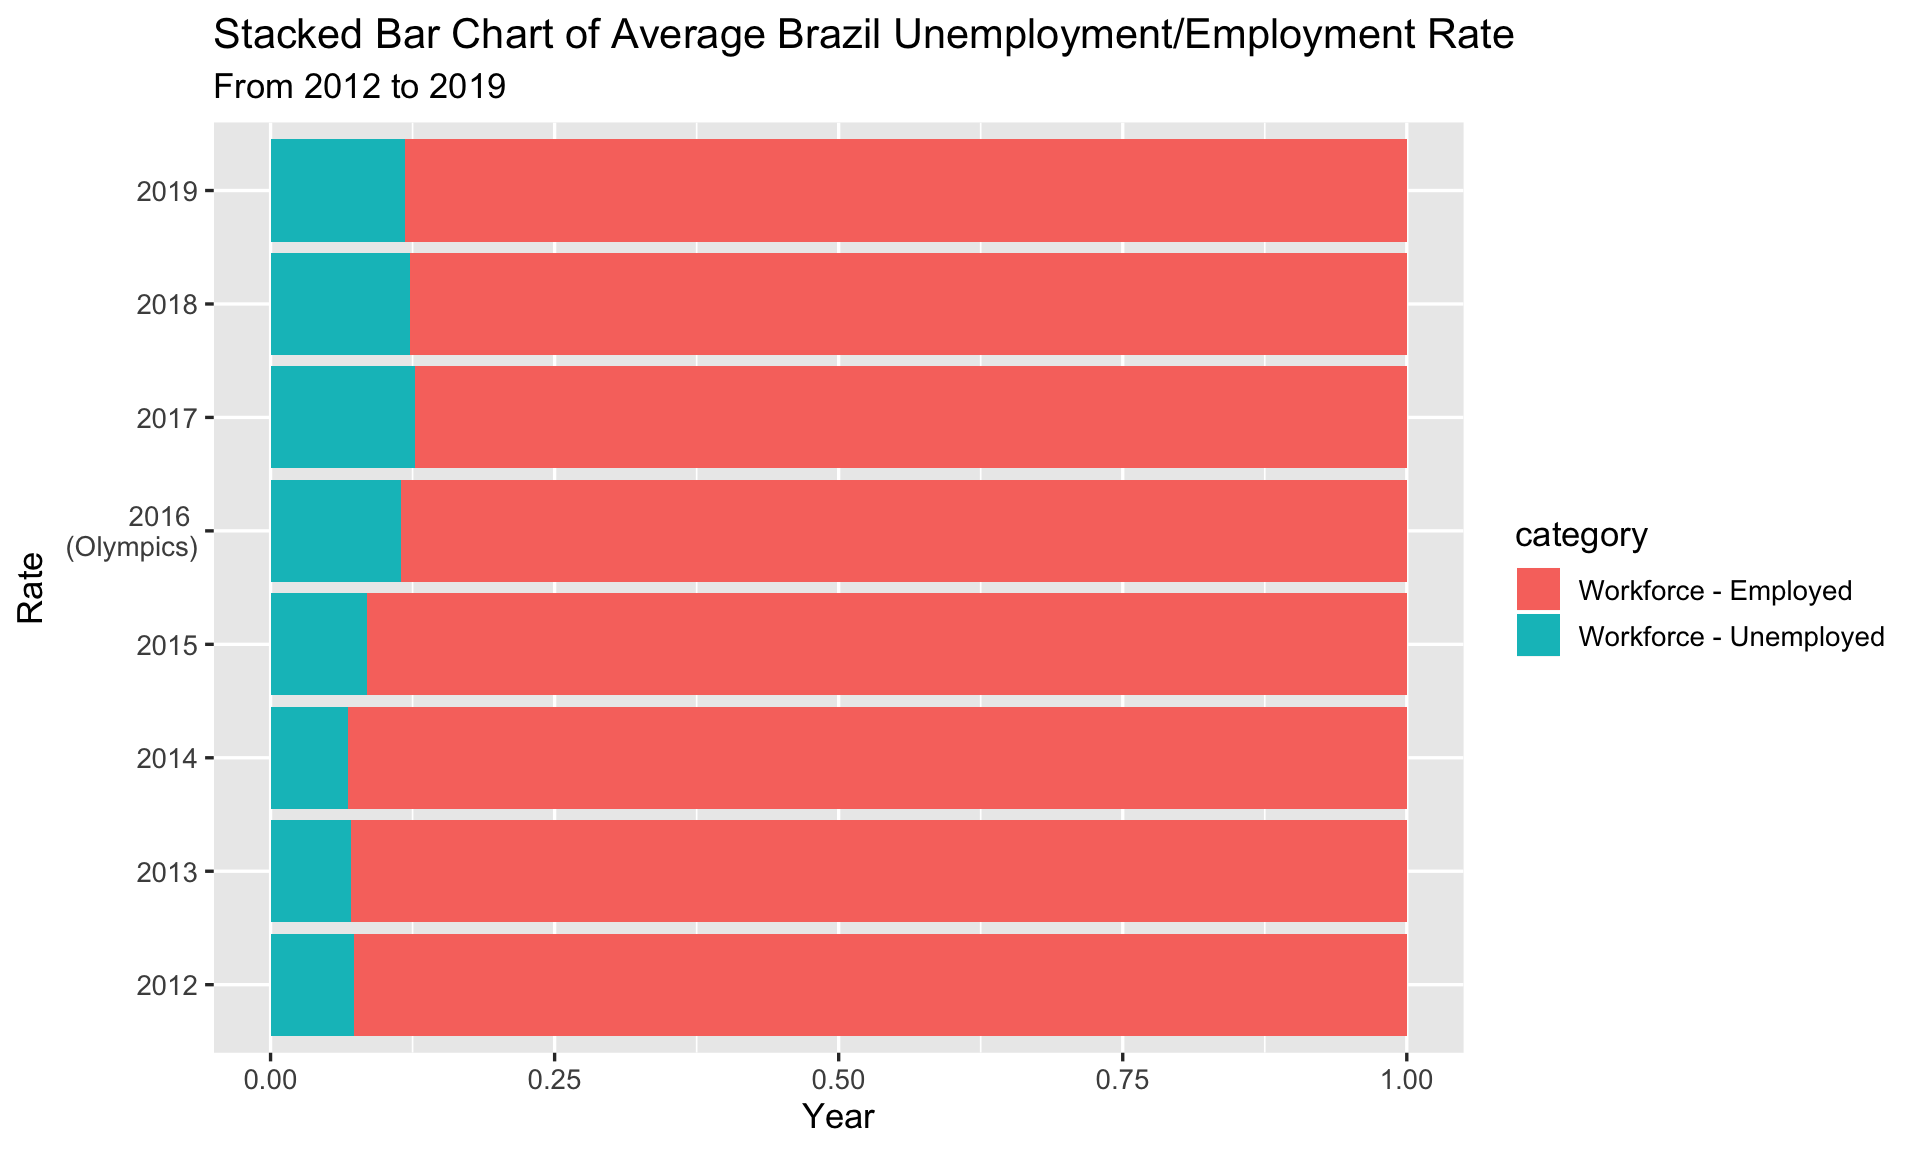
The stacked bar chart shows that year 2017 has the highest unemployment rate, whereas year 2014 has the lowest unemployment rate. Also, the unemployment rate keeps increasing from 2015 to 2017. The above plot confirms our conclusion that the 2016 Rio Olympics did not appreciably benefit Brazil as measured through the unemployment rate. In fact, during the years that follow the Olympics the unemployment rate seems to increase, not decrease, which suggests a possible negative effect that could be the subject of future exploration.
Unemployment Rate by Regions
Now let’s move to the regional level. We want to check whether the 5 regions follow a same pattern as the national unemployment rate.
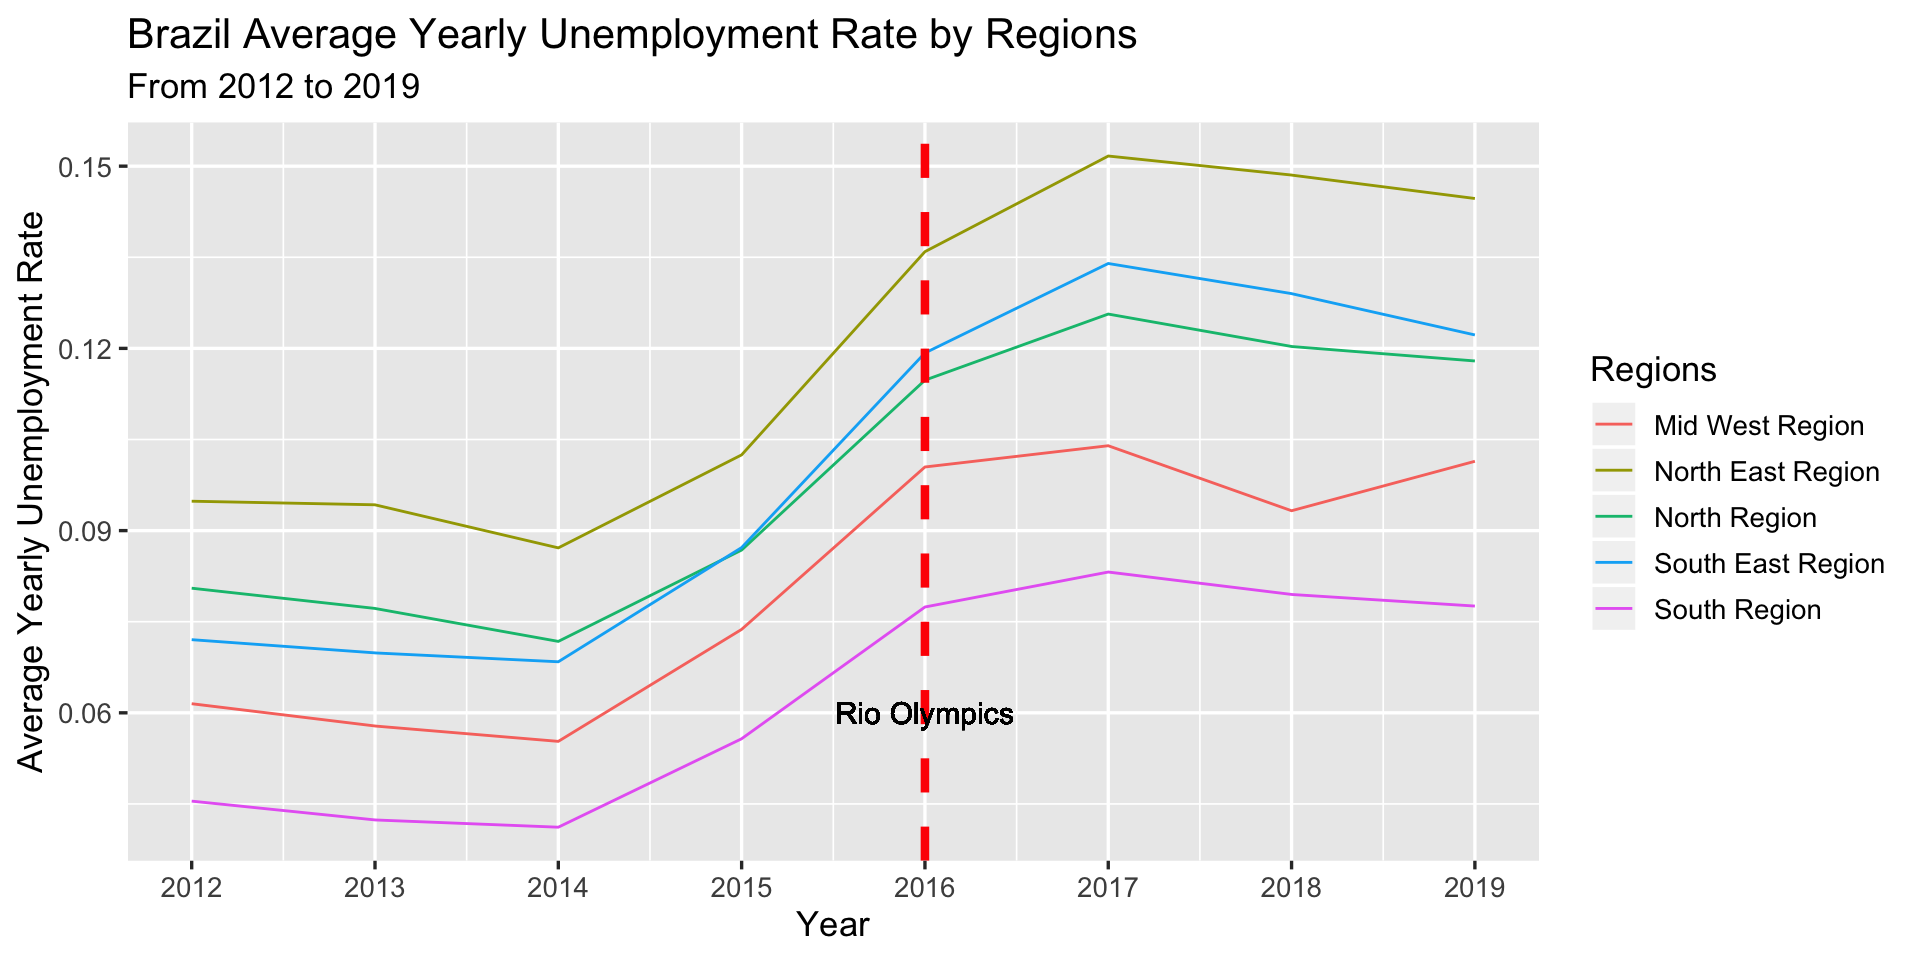
From 2012 to 2014, the unemployment rate decreases for the 5 regions. However, during the period between 2014 and 2017, the unemployment rate increases for the 5 regions. The unemployment rate starts to decrease after 2017. The regions follow the same pattern as the national pattern, except Mid West region has an increasing unemployment rate from 2018 to 2019.
For more precise conclusion, we also calculate the exact regional unemployment rate increasing rate.
Unemployment Rate Increasing Rate by Regions from 2013 to 2019
Since 2014, the average unemployment rate keeps increasing for all of the 5 regions until 2017. The highest increasing rate appears at year 2016 which is the Olympics year for all of the 5 regions. The unemployment rate drops starting from 2018. Therefore, the 2016 Rio Olympic games did not benefit Brazil’s unemployment rate. There are no significant differences in regional unemployment patterns observed as well.
5.4 Brazil Tourism
Now we want to analyze Brazil tourism to check whether the Olympics benifits the tourism, especially for the South East region.

From the multiple time series plot, we find that from 2006 to 2018, South East region always has a much higher number of tourism jobs than the other regions. After 2009, the final selection year, all of the 5 regions seems to increase faster than before in the number of tourism jobs. However, from 2015 to 2017, South East region seems to decreases slightly. This shows that the Olympics does not necessarily increase the number of tourism jobs for South East region. The decreasing in number of tourism jobs in South East region complies with the pattern of Brazil unemployment rate.
5.5 Brazil Conclusion
The above analysis allowed us to view the impact of the Olympics on Brazil and its constituent regions through an economic and tourism lens. We concluded through Anova tests that there are no statistically significant distinctions between the growth rates of each region before and after the Olympics. We also observe that although changes do occur in income distribution, these do not seem to be attributable to the Olympics. A similar conclusion is reached through analysis of unemployment rate – in fact this data suggests a possible negative impact of the hosting of the Olympics! Finally, analysis of tourism jobs shows almost no changes whatsoever as a result of the Olympics. All of these analyses support our conclusion that the Olympics did not have a considerably positive impact on Brazil or its constituent regions.